Market Commentary: May 2023

Compound is a digital family office for entrepreneurs, professionals, and retirees who want the personal touch of a dedicated advisor accompanied by a beautiful digital experience.
At a Glance
- Investors found relief in the debt ceiling resolution at the end of May
- Tech stocks posted sharp gains driven by solid profitability and AI enthusiasm
- Interest rates rose on debt default worries, hurting fixed income returns
- Investors pricing in a “soft landing”
What a (Debt) Relief
After a May dominated by escalating concerns of a potential default on government debt, investors were relieved when a debt ceiling deal was reached to end the month. While the negotiations grabbed much of the headlines, market moves continued to be driven by questions about the trajectory of the economy, inflation and Fed policies. Equity markets were mixed for the month with the large cap US technology stocks again posting strong returns while more economically sensitive segments and non-US markets saw declines. Interest rates rose steadily during the month in response to the default worries, but fell sharply to end the month once the outline of the deal became clear. On the economic front, June’s employment report showed a still strong labor market, but the unemployment rate increased and corporate earnings continued to soften.
Equity Returns: May and Year-to-Date 2023

Stocks posted mixed returns in April. The NASDAQ returned to the top spot for the month, rising 5.93% and pushing its year-to-date return up to 24.06%.3 Enthusiasm for rapidly advancing AI applications pushed related stocks up sharply and greatly narrowed the breadth of the market leadership. The broader S&P 500 index was up just 0.43% in May and the Dow fell 3.17%.4 In the US, the economically sensitive small cap sector, especially its value half, posted negative returns for the month.5 Outside of the US, developed and emerging market equities fell over 2% with returns especially weak across Europe.6
Among sectors, gains were concentrated in technology and communications stocks. All other sectors posted negative returns, with performance especially weak in Energy (-10.61% for May), Materials (-7.11%) and the defensive Utilities and Staples sectors (-6.36% and -6.21%, respectively).7 So far this year, the Tech sector has accounted for 83% of the S&P 500’s gain, with the top eight performing stocks (in info tech and communications services) accounting for all of the gains.8 The spread between the dominant tech and communications mega cap companies and the broader market, as well as the hype around AI technology, reminds some of the dot com experience of the late 1990s which ultimately delivered a few winners but produced disappointment for the segment as a whole.9 Still, another factor boosting the relative performance of these companies so far this year is the tendency for investors to favor higher “quality” companies (those demonstrating steady and more resilient profitability) when economic conditions and corporate earnings weaken.
Fixed Income Returns: May and Year-to-Date 2023
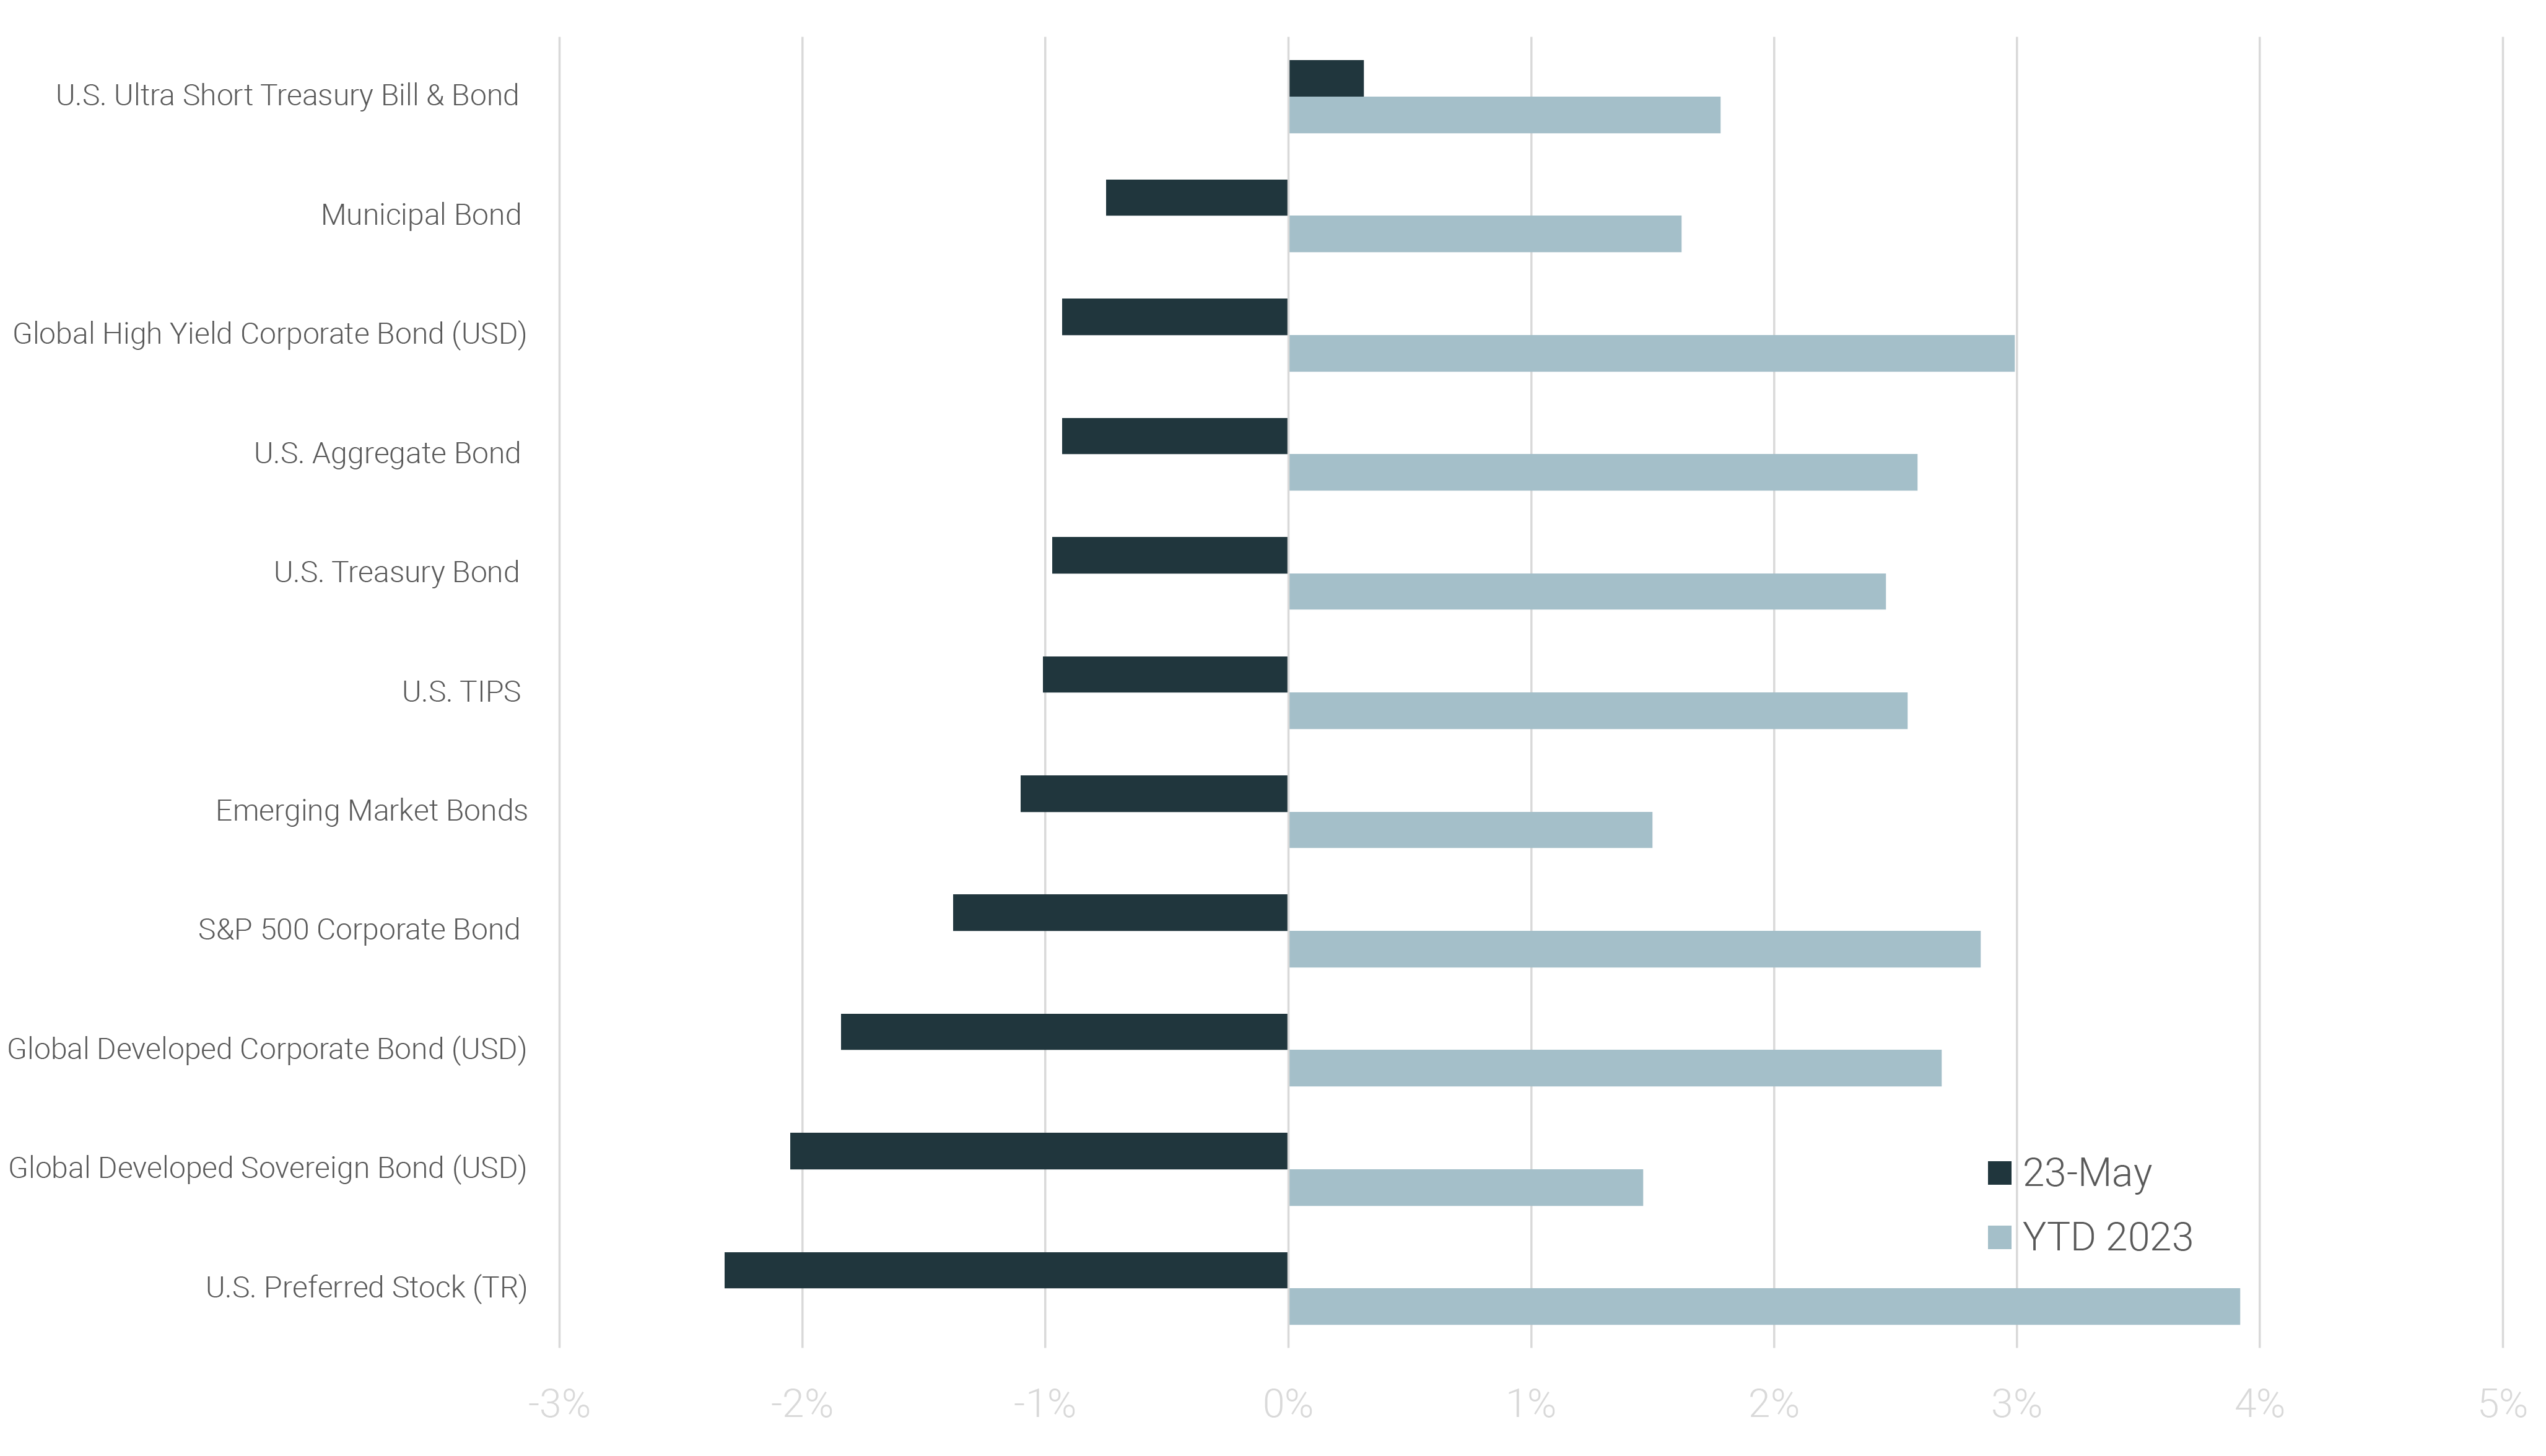
With rising rates across maturities for most of the month and another 25 basis point increase in policy rates by the Fed on May 3rd, fixed income returns were weak across the board.10 The year-to-date performance of the major segments remains solid and a marked change from 2022, however. Markets seem to be pricing in no increase in rates by the Fed in June and indeed expecting rate cuts by the end of the year despite Fed Chairman Powell noting that the Fed did not expect to lower rates this year.11
Now back to the economy
So far in 2023, investors seem to have priced in a soft landing for the US economy. Given the 5 percentage point increase in interest rates by the Fed since early last year and the reduction in their securities holdings, most economic models would forecast a recession in the current year. The Fed’s own forecasts point to a mild recession starting later this year.12 Many measures of economic activity remain strong, however, most notably the still tight labor markets. 339,000 jobs were added to non farm payrolls in June, well above economist estimates.13 The unemployment rate edged up 0.3% to 3.7% on a decline in jobs and a steady labor force (these numbers are from a different household - rather than establishment - survey).14 Many observers consider employment measures to be lagging rather than leading indicators of economic activity. The Conference Board’s Leading Economic Indicator index (LEI) does not contain either the payroll employment figures or the unemployment rate.15 The LEI for April (released on May 18th) was down for the thirteenth consecutive month and continues to signal contraction of economic activity starting in Q2 leading to a mild recession by mid-2023.16
Other measures also show the economy continued to grow through the first quarter. The second estimate of Q1 2023 GDP growth released on May 25th showed a 1.3% increase in economic activity, down from 2.6% in Q4 2022, but clearly not in recession.17 The GDP growth was bolstered by still rising consumer spending. April retail and food service sales were up 0.4% in April from March and 1.6% above levels from a year earlier.18 With consumption driving about 70% of US GDP, the behavior of consumers will determine the path of the economic cycle. And, since consumption is closely linked to employment and wages, the trajectory of those indicators will be key.
On the other hand, the signs of slowing are seen in tighter credit conditions, weak consumer expectations, and declining new manufacturing orders and hours worked.19 Declining orders and hours worked in manufacturing go hand in hand and would signal a coming weakening in corporate earnings. So far, however, earnings have held up, with Q1 results for the S&P 500 up 4.8% over Q4 2022, although estimates for Q2 earnings expect a 1.1% decline from the Q4 levels.20 For equity markets, which ultimately discount future earnings, these patterns will matter greatly. While a mild recession and weaker corporate earnings may ultimately unfold, so far this year investors have signaled a different opinion.
1 https://www.spglobal.com/spdji/en/index-family/equity/
2 https://www.nasdaq.com/market-activity/index/comp/historical
3 https://www.nasdaq.com/market-activity/index/comp/historical
4 https://www.spglobal.com/spdji/en/indices/equity/sp-500/#overview
5 https://www.spglobal.com/spdji/en/indices/equity/sp-600/#overview
6 https://www.msci.com/end-of-day-data-search
7 https://www.spglobal.com/spdji/en/index-family/equity/us-equity/sp-sectors/#indices
8 https://www.spglobal.com/spdji/en/commentary/article/us-equities-market-attributes
9 https://www.spglobal.com/spdji/en/commentary/article/us-equities-market-attributes
10 https://www.spglobal.com/spdji/en/index-family/fixed-income/
11 https://www.spglobal.com/spdji/en/commentary/article/us-equities-market-attributes
12 https://www.federalreserve.gov/monetarypolicy/fomcminutes20230503.htm
13 https://www.bls.gov/news.release/empsit.nr0.htm
14 https://www.bls.gov/news.release/empsit.nr0.htm
15 https://www.conference-board.org/topics/us-leading-indicators
16 https://www.conference-board.org/topics/us-leading-indicators
17 https://www.bea.gov/news/2023/gross-domestic-product-second-estimate-corporate-profits-preliminary-estimate-first
18 https://www.census.gov/retail/sales.html
19 https://www.conference-board.org/topics/us-leading-indicators
20 https://www.spglobal.com/spdji/en/commentary/article/us-equities-market-attributes
Disclaimer: The views expressed in this material are the views of Atomi Financial Group, Inc. dba Alternativ Wealth through the period ended June 2, 2023 and are subject to change based on market and other conditions.
This document contains certain statements that may be deemed forward-looking statements. Please note that any such statements are not guarantees of any future performance and actual results or developments may differ materially from those projected.
All information is from Alternativ Wealth unless otherwise noted and has been obtained from sources believed to be reliable, but its accuracy is not guaranteed. There is no representation or warranty as to the current accuracy, reliability or completeness of, nor liability for, decisions based on such information and it should not be relied on as such.
Alternativ Wealth is not, by means of this publication, rendering legal, tax, accounting, consulting, securities, real estate or other professional advice or services, and this publication should not be used as a basis for any investment decision or as a substitute for consultation with professional advisors. Alternativ Wealth shall not be held responsible for any loss sustained by any person that relies on information contained in this publication.
This publication and the information contained herein is intended to offer general information and is not to be construed as a recommendation to make any decision concerning the purchase or sale of securities, insurance products, real estate, accounting and or legal services. Such offers are made only by prospectus, contract, or engagement agreement. A prospectus or contract should be read thoroughly and understood before investing or sending money. Investments involve risk. Investment return and principal value will fluctuate, so that your investment, when redeemed, may be worth more or less than its original cost. Past performance is not a guarantee of future results. All such decisions should be based on the consideration of specific objectives, relevant facts, pertinent issues and particular circumstances, and should involve appropriate professional advisors.